In this guide we will show how to configure our docker-compose to run a monitoring stack for RabbitMQ with Prometheus and Grafana.

Project structure:
├── compose.yaml├── grafana│ └── dashboards│ └── rabbitmq-overview.json│ └── dashboards-provisioning│ └── dashboards.yml│ └── datasources│ └── datasources.yml├── prometheus│ └── prometheus.yml├── rabbitmq│ └── Dockerfile└── README.mdRequirements
The first thing we need is to have Docker and Docker Compose installed.
Configuration
RabbitMQ
To configure RabbitMQ, we are going to create a Dockerfile that allows us to install the Prometheus plugin and expose port 15692.
FROM rabbitmq:3.12.0-managementRUN apt-get update && apt-get install -y wgetRUN rabbitmq-plugins enable rabbitmq_managementEXPOSE 5672 15672CMD ["rabbitmq-server"]Prometheus
To configure Prometheus, we will create a prometheus.yml file that allows us to configure the RabbitMQ scrape.
global:  scrape_interval: 5s
scrape_configs:  - job_name: "prometheus"    scrape_interval: 5s    static_configs:      - targets: ["localhost:9090"]
  - job_name: "rabbitmq-server"    static_configs:      - targets:          - "rmq0:15692"
  - job_name: "rabbitmq-server-detailed"    metrics_path: "/metrics/detailed"    params:      family: ["queue_coarse_metrics"]    static_configs:      - targets:          - "rmq0:15692"
In the scrape_configs settings we are configuring the RabbitMQ scrape on port 15692, which is the internal port that exposes the Prometheus plugin, in its default /metrics path.
The static_configs is the list of targets we are going to monitor. In this case, we only have one target which is rmq0:15692, which is the name of the RabbitMQ service in the compose.yaml file, which has the hostname rmq0.
Grafana
In this case we have to configure our dashboards and datasources. To do this, we will create a folder grafana with the following subfolders and files:
-
dashboards: In this folder we are going to save the dashboards we want to import into Grafana. In this case, we are going to save therabbitmq-overview.jsonfile that contains the RabbitMQ dashboard. You can find it here. -
dashboards-provisioning
: In this folder we are going to save thedashboards.yml` file that allows us to configure the dashboards provisioning in Grafana. -
datasources
: In this folder we will save thedatasources.yml` file that allows us to configure the Prometheus datasource in Grafana.
Docker Compose
Finally, we are going to create our configuration kernel in the compose.yaml file.
version: "3"
networks:  rabbitmq-prometheus:
services:  prometheus:    image: prom/prometheus    container_name: prometheus    command:      - "--config.file=/etc/prometheus/prometheus.yml"    ports:      - 9090:9090    networks:      - "rabbitmq-prometheus"    restart: unless-stopped    volumes:      - ./prometheus:/etc/prometheus      - prom_data:/prometheus  grafana:    image: grafana/grafana    container_name: grafana    ports:      - 3000:3000    restart: unless-stopped    networks:      - "rabbitmq-prometheus"    environment:      - GF_SECURITY_ADMIN_USER=admin      - GF_SECURITY_ADMIN_PASSWORD=grafana    volumes:      - ./grafana/datasources:/etc/grafana/provisioning/datasources      - ./grafana/dashboards-provisioning:/etc/grafana/provisioning/dashboards      - ./grafana/dashboards:/var/lib/grafana/dashboards  rabbitmq:    image: rabbitmq    container_name: "rabbitmq"    build:      context: .      dockerfile: ./rabbitqm-cluster/Dockerfile    ports:      - 15673:15672      - 15693:15692    networks:      - "rabbitmq-prometheus"    hostname: rabbitmq    environment:      RABBITMQ_ERLANG_COOKIE: rabbitmq-prometheus    volumes:      - ~/.docker-conf/rabbitmq/data/:/var/lib/rabbitmq/      - ~/.docker-conf/rabbitmq/log/:/var/log/rabbitmq
volumes:  prom_data:
In this file we are configuring three services:
-
prometheus: We configure the Prometheus service with theprometheus.ymlfile and port 9090, connected to therabbitmq-prometheusnetwork, we also configure a volume to store Prometheus data. -
Grafana
: We configure the Grafana service with port 3000, connected to therabbitmq-prometheus` network, we also tell it the administrator credentials and configure the volumes for the provisioning of dashboards and datasources. -
rabbitmq: We configure the RabbitMQ service with the Dockerfile we created earlier, we expose ports 15672 and 15692, connected to therabbitmq-prometheusnetwork, we configure the hostname and volumes for storing RabbitMQ data and logs.
ports 15673 and 15693 are the ports we are going to use to access the RabbitMQ interface and ports 15693 and 15692 are the ports we are going to use for the Prometheus scrape.
Execution
To run the monitoring stack, we just need to execute the following command:
if you have the docker-compose V1 version:
docker-compose up -dif you have the docker-compose V2 version:
docker compose up -dthe
-dflag is to run in the background. If you don’t use it, you will see the logs of the services in the terminal.
Once all the services are running, we can access the different interfaces:
- Prometheus: http://localhost:9090
- Grafana: http://localhost:3000
- RabbitMQ: http://localhost:15673
- RabbitMQ Prometheus Metrics: http://localhost:15693/metrics
Check if Prometheus is scraping RabbitMQ metrics
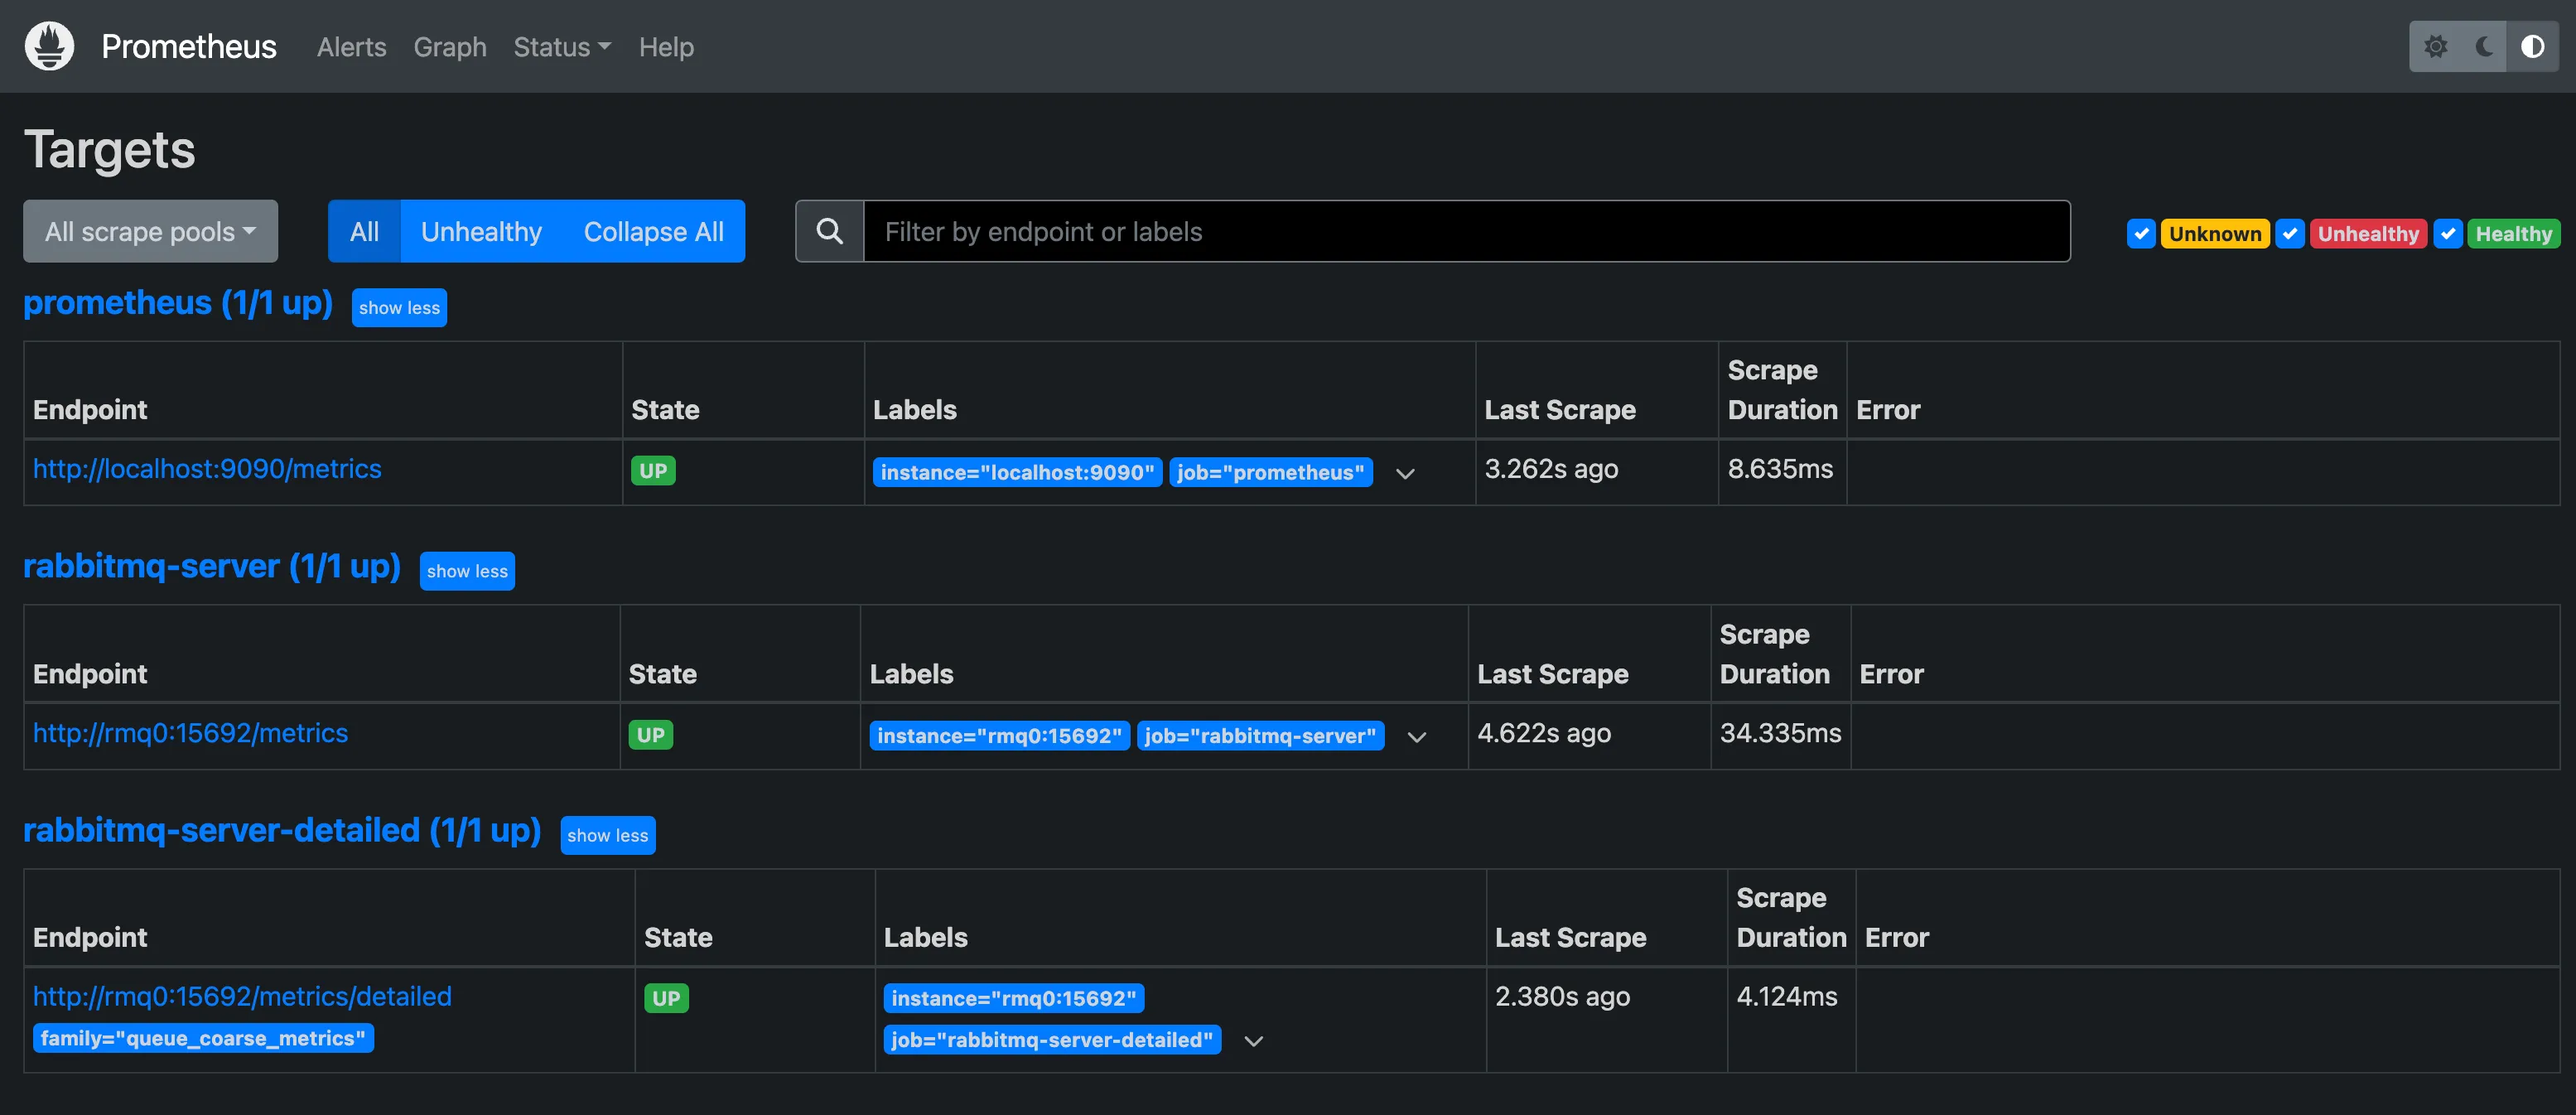
To check if Prometheus is scraping the RabbitMQ metrics, go to the Prometheus interface http://localhost:9090 and now go to the Status tab and click on Targets.
There we will see that the target rmq0:15692 is in UP status and that the last time it was scraped was a few seconds ago.

Creating a queue in RabbitMQ
Once we enter the RabbitMQ interface, and log in with the default credentials which are guest:guest, we are going to create a queue to see how it is reflected in the Grafana dashboards.
To do this, go to the Queues tab and click on Add a new queue.
As queue name we are going to put test_prometheus and click on Add queue.
Now we click on the queue that we have just created or we go to the following link /test_prometheus and we will see that the queue is empty.
We are going to send a message to the queue, for it, we click on Publish message and in the Payload field we put the message that we want to send, for example Hello World! and we click on Publish message.
Viewing dashboards in Grafana
Now we go to the Grafana interface http://localhost:3000 and log in with the credentials we configured in the compose.yaml file which are admin:grafana.
Once logged in, we go to the Dashboards tab.
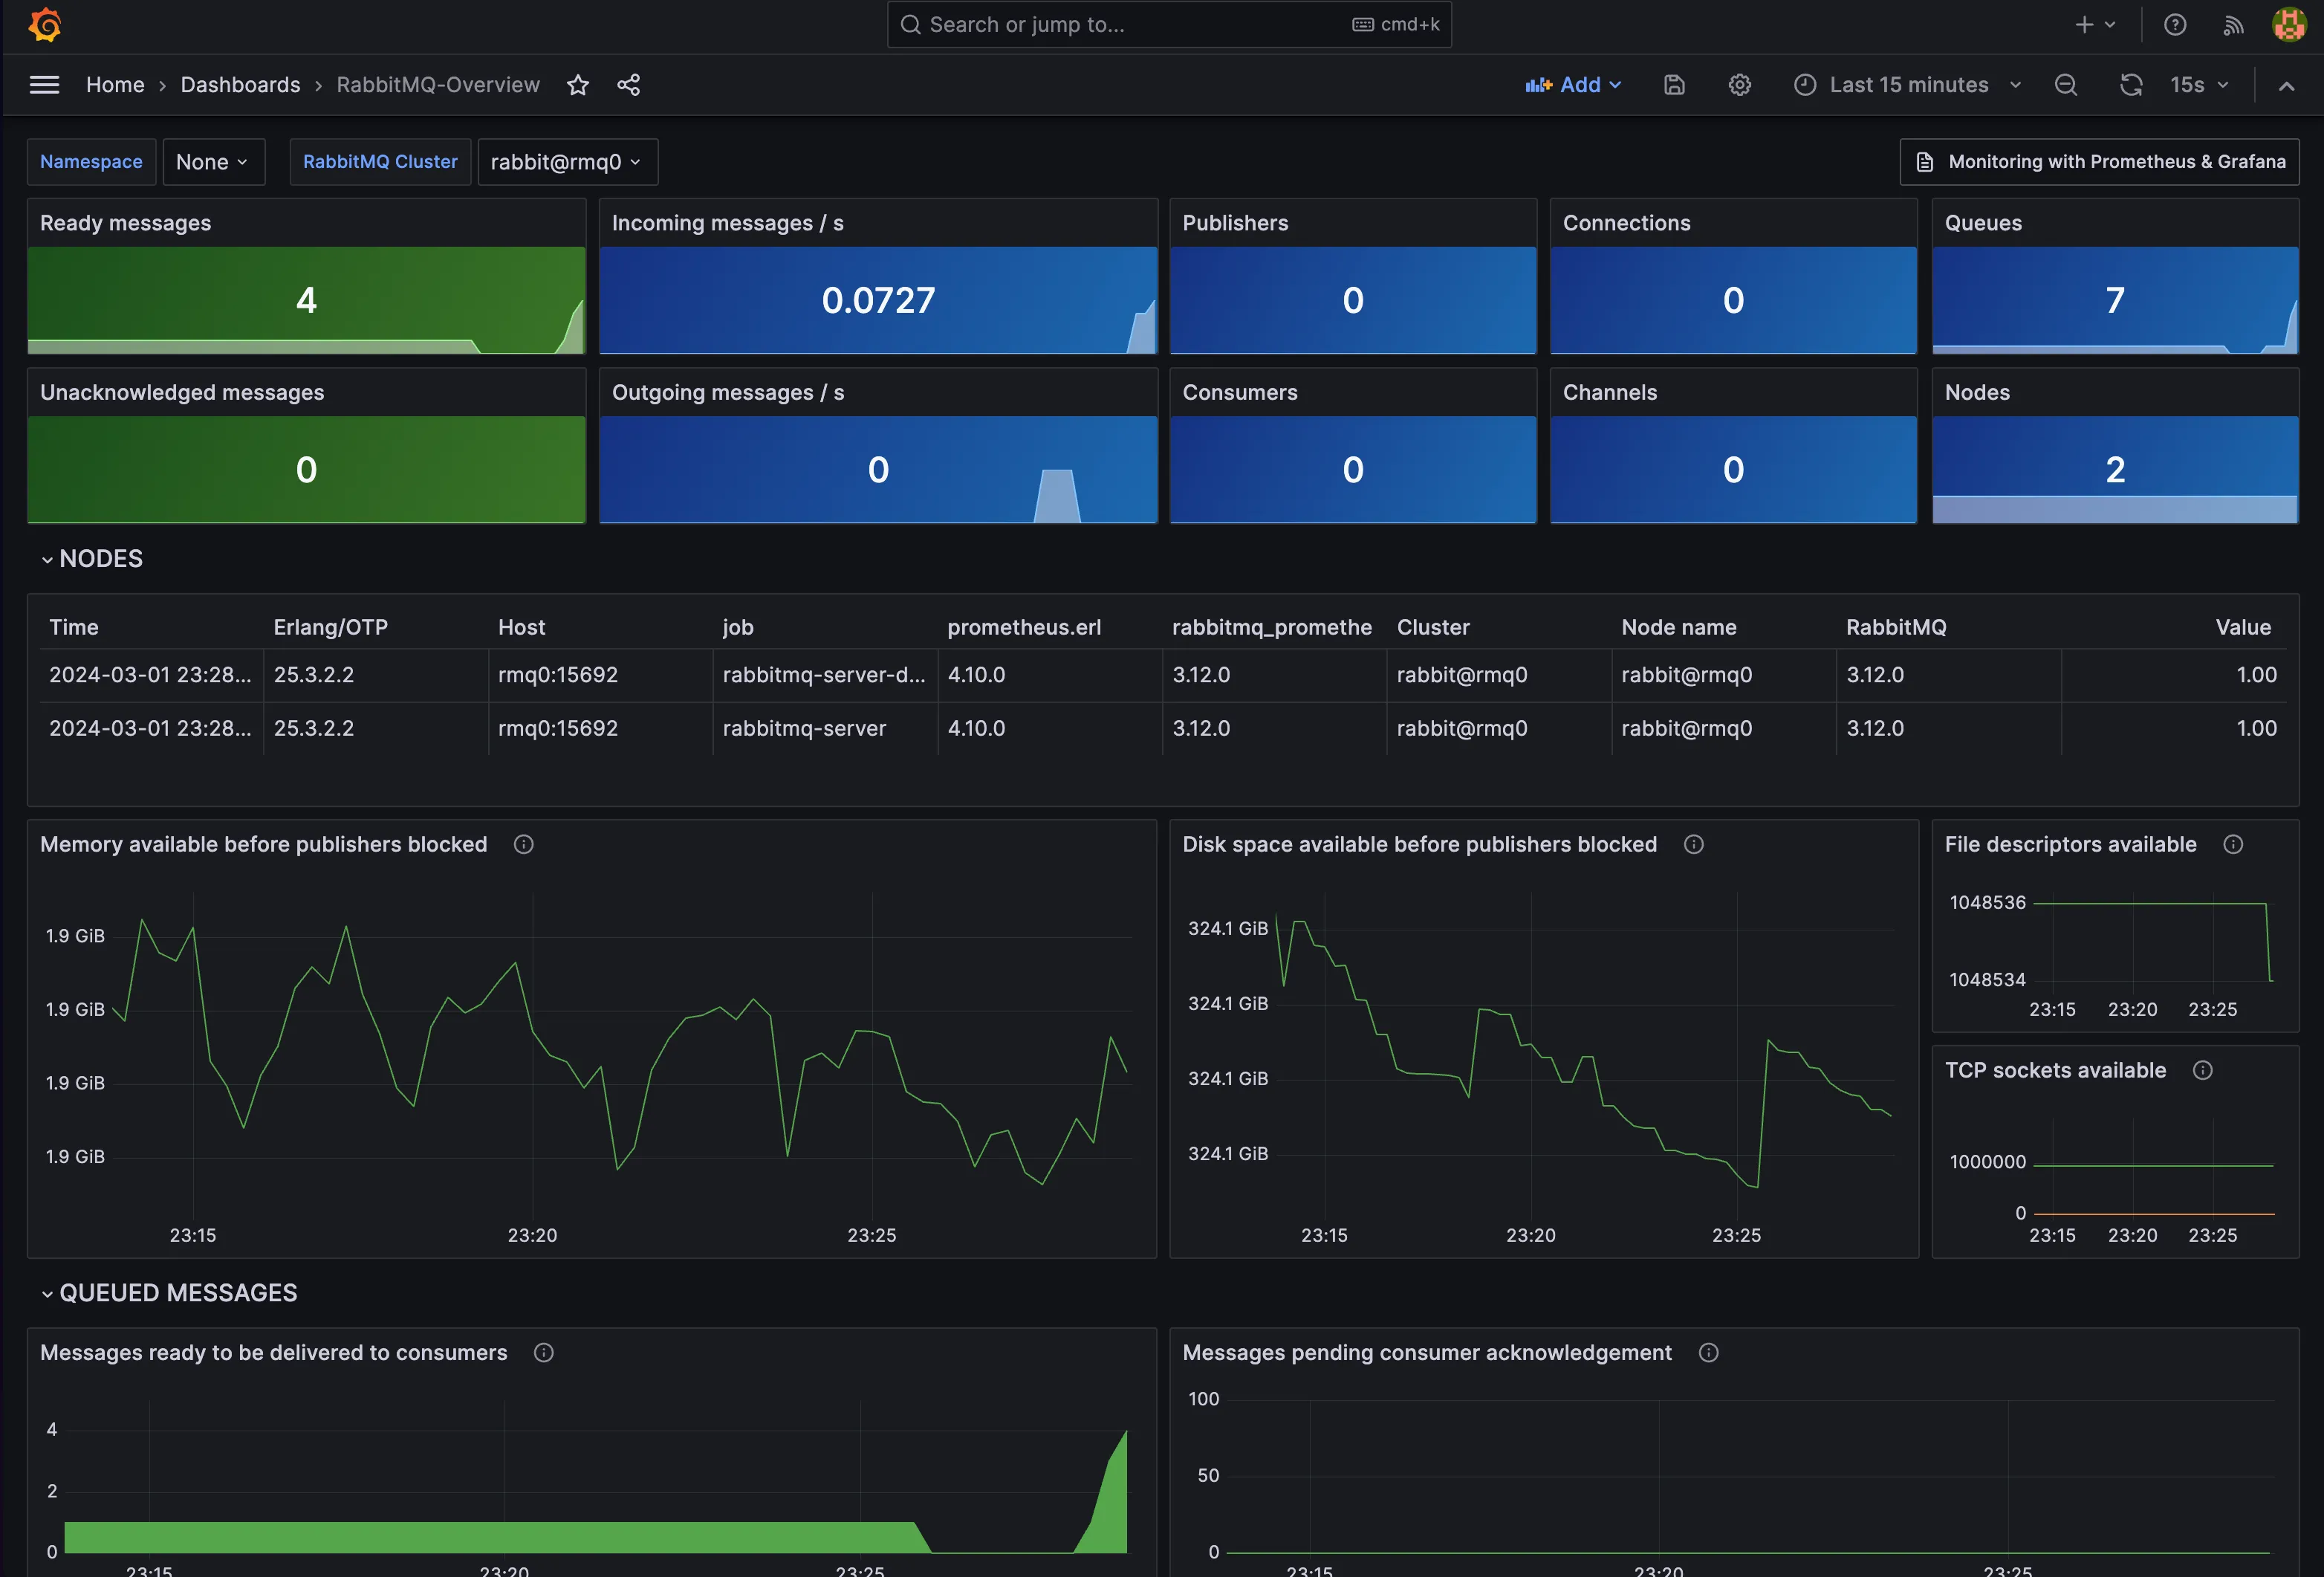
There we will see that the RabbitMQ-Overview dashboard is available, we click on it and we will see the RabbitMQ metrics.
If you do not see the dashboard, you can import it manually. To do so, click on
newand thenimportand paste the following code10991in theFind and import dashboards for common applications at grafana.com/dashboardsoption
Now we can see that in the RabbitMQ dashboard, in the Queues section there is the queue we just created and it has a message in the queue.
Conclusion
We come to the end of this extensive guide, which has everything you need to set up a monitoring stack for RabbitMQ with Prometheus and Grafana.
If you have any questions, feel free to leave a comment or open an issue in this repository.