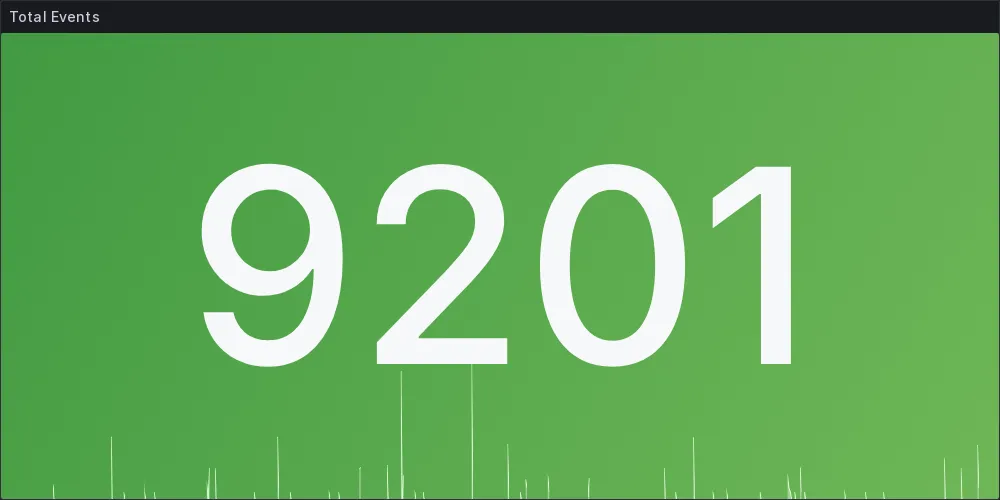
We are going to see how we can convert our Grafana dashboards into images, so we can share them anywhere, for example in slack, discord, microsoft teams, etc. With this we will be able to preview our dashboards without the need to enter Grafana and create automations to send them to our teams.
Prerequisites
Note: We need a running instance of Grafana, version 8.3.11 or higher. Grafana >=8.3.11
We need to have the plugin Grafana Image Renderer installed in our Grafana, to be able to render our dashboards in images, and to generate the necessary endpoints to be able to make the requests.
The first option is to install this plugin from its CLI, using the following command:
grafana-cli plugins install grafana-image-rendererAnother option is to install it via docker, for that we need to add the following image to our docker-compose:
version: "2"services: grafana: image: grafana/grafana:latest ports: - ‘3000:3000’ environment: GF_RENDERING_SERVER_URL: http://renderer:8081/render GF_RENDERING_CALLBACK_URL: http://grafana:3000/ GF_LOG_FILTERS: rendering:debug renderer: image: grafana/grafana-image-renderer:latest ports: - 8081To start the services, run:
docker-compose upNote: Make sure you have your API Key from Grafana, in order to be able to make API requests.
Usage
Step 1: Get the UID of the dashboard
The first thing we need is the UID of the dashboard we want to render, for this we are going to use the Grafana API.
curl -H "Authorization: Bearer API_KEY" \ "https://GRAFANA_URL/api/search?type=dash-db"[ { "id": 36, "uid": "vmIdaerGu", "title": "AWS ALB Cloudwatch Metrics", "type": "dash-db", "tags": [ "alb", "aws", "cloudwatch" ], ... }, { "id": 37, "uid": "AWSEc2001", "title": "AWS EC2", "type": "dash-db", "tags": [ "cloudwatch", "monitoringartist" ], ... }, ...]With this we will get a list of all the dashboards we have in our Grafana, and we will be able to see the UID of each one, so we are only interested in the uid and title node to know which dashboard we want to render.
Step 2: Get the dashboard detail
Next we need to get the detail of this dashboard, for that we use the following command:
curl -H "Authorization: Bearer API_KEY" \ "https://GRAFANA_URL/api/dashboards/uid/UID_DEL_DASHBOARD"{ "meta": { ... }, "dashboard": { ... "panels": [ { ... "id": 19, "title": "Healthy targets" }, { ... "id": 20, "title": "Unhealthy targets" }, ] }}From here we will obtain the JSON with all the information of our dashboard, and its panels in the node dashboard.panels, we are interested in the id of each panel to be able to render it and the title to identify it.
Step 3: Render the panel
As a last step, we need to make the request to the endpoint of our Grafana Image Renderer, for that we use the following command:
curl -H "Authorization: Bearer API_KEY" \ "https://GRAFANA_URL/render/d-solo/DASHBOARD_UID/graph-panel?orgId=ORG_ID&from=INIT_TIMESTAMP&to=END_TIMESTAMP&panelId=PANEL_ID&width=1000&height=500&tz=UTC&scale=1" \ --output imagen_dashboard.pngMake sure you change the values of these mandatory variables:
API_KEY: with your Grafana API Key.GRAFANA_URL: with the URL of your Grafana.DASHBOARD_UID: with the UID of the dashboard you want to render (we got it in the first step).INIT_TIMESTAMP: with the start timestamp of the image. (Example: 1724011204)END_TIMESTAMP: with the end timestamp of the image. (Example: 1724011204)PANEL_ID: with the ID of the panel you want to render. (We got it in the second step)ORG_ID: with the ID of your organisation.
Note: You can change the
widthandheightto change the size of the image. You can also change thetzto change the timezone and thescaleto change the image quality.
This will generate an imagen_dashboard.png file with your dashboard image.

Extras
I have left an example of a library I made in Typescript to make this easier,
This library provides you with 3 methods to render your dashboards, which are the 3 steps we saw before.
Take it as a guide to make your own automations.
You can see the code in this repository